
World
A Peg Is Paid for in Reserves, Until It Isn’t
The promise sounds absolute—10 units of local currency for one dollar, every day, no exceptions.
When the World Bank reports that sending money abroad costs 6.62 percent, the number is an average. But average is a polite word for a truth nobody wants to admit: the same $200 can cost 4 percent on one corridor and 15 percent on another, and the difference is almost never the fee printed on the receipt.
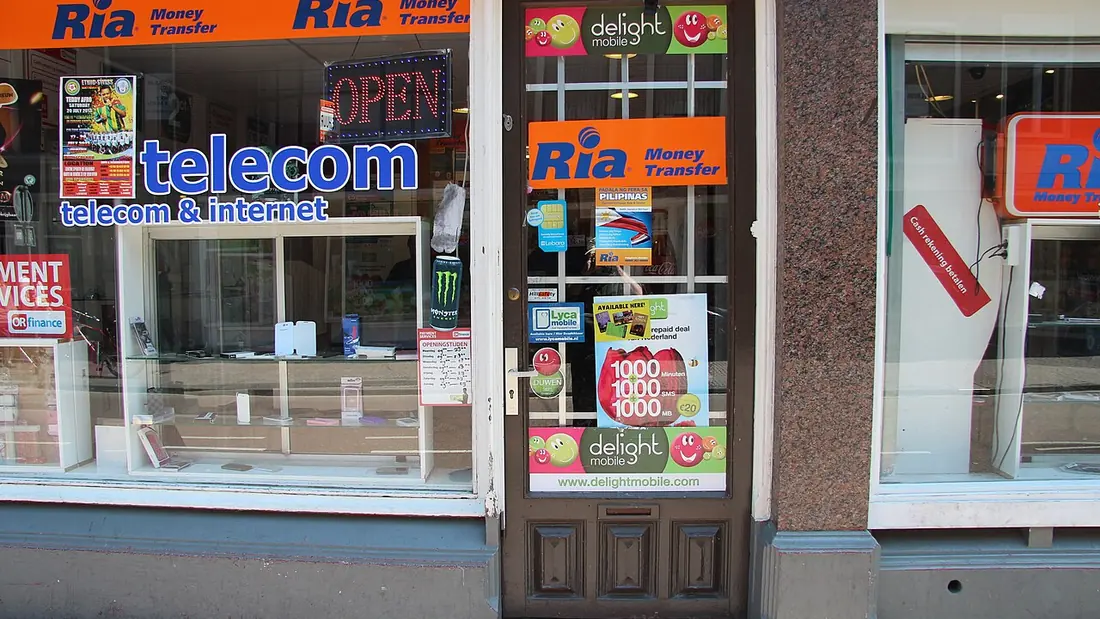
The World Bank’s “total cost” measure packs two charges into one figure—the advertised transfer fee and the exchange-rate margin the provider keeps. That margin is silent, unbilled, and often the larger half of the price. In the third quarter of 2024, the global average of this combined cost sat at 6.62 percent, down barely a tick from 6.65 percent the quarter before and still more than double the UN target of 3 percent that countries committed to reach by 2030.
The UN Sustainable Development Goal target 10.c demands that remittance transaction costs fall below 3 percent of the amount sent, and that no corridor remains above 5 percent. The yardstick is the World Bank’s Remittance Prices Worldwide database, which tracks the cost of sending exactly $200 or its equivalent. Not $500, not a monthly average, just $200. The database covers 377 corridors—48 sending countries to 111 receiving countries—and computes the simple average of the total price quoted by each service provider in a corridor. That total price is not the fee line. It is the fee plus the exchange-rate margin, the spread between the rate the provider shows the customer and the mid-market rate.
That definition matters because it forces competitors to compete on a combined number, not a cosmetic zero-fee sticker with a fat spread built in. It also means the global average can be pulled down by routes where digital operators have crushed fees, while still hiding corridors where cash-dependent networks keep the true cost punishingly high. The Bank itself warns that non-transparent services—those that do not disclose their total cost—are excluded from the global average. In other words, the real average in some corridors is almost certainly higher.
A single global figure like 6.62 percent tells you nothing about what happens on a specific route. The same database that yields the average also records that the Malaysia-to-Myanmar corridor jumped from a 6–7 percent total cost to 14–15 percent. That is not a rounding error. It is a doubling, driven by shifts in distribution, compliance, and the mix of cash versus digital channels. Across the 377 corridors, prices diverge wildly because each route carries its own market structure: a handful of banks, a dominant money transfer operator with agent exclusivity, or a regulatory regime that makes it expensive to move local currency. The database shows the averages, but the corridor-level spreads tell the real story: $200 that costs $12 to send one way costs $30 going another.
The difference between digital and non-digital services is larger than the difference between most corridors. In the third quarter of 2023, digital remittances carried a global average total cost of 4.84 percent, while non-digital ones clocked in at 6.77 percent—a gap of nearly two percentage points. But the channel mix is not just an app-versus-agent story. A BIS paper reports that in Q4 2020, banks charged an average total cost of 10.55 percent to send $200, while non-bank providers averaged 5.99 percent. Across all providers, the average was 6.74 percent. The bank premium persists even though the exchange-rate margin is nearly identical: 2.14 percent for banks and 2.23 percent for non-banks, per the same BIS data. That margin equality is the hidden logic of the remittance price. The spread does not get cheaper just because the provider calls itself digital.
For a $200 transfer, a 2.14 percent exchange-rate margin works out to about $4.28. If the advertised fee is $3.99, the total cost is $8.27, or 4.1 percent. The customer sees the $3.99 and assumes the deal is decent. The provider collects the margin on top. In corridors where non-transparent operators are excluded from the database, the true spread can be even larger, and the official average may understate what a migrant worker actually pays at the corner agent.
The BIS analysis makes plain that both banks and non-banks build the same-sized rate cushion into their pricing. This is not a mistake; it is a business model. A market where the fee is low but the spread is wide still violates the 3 percent target just as surely as a high-fee corridor. The target measures total cost, and total cost does not care whether you lost the money on page one or page two of the transaction slip.
The same BIS paper reported that cash sending and cash receiving are more costly in corridors where digital money transfer operators are present, presumably because the physical infrastructure adds a layer of expense that digital-only providers do not have to cover. In routes where agents are the only way to disburse money, prices stay high even when a mobile wallet option exists in the sending country. The Malaysia-Myanmar spike suggests what can happen when that cash-dependent structure runs into a change in regulatory or market conditions. Exclusivity agreements between a dominant operator and its agent network are understood in the industry to limit price competition, and the non-inclusion of non-transparent services in the global average only softens the picture. The result is a set of corridors where the total cost refuses to budge from double digits, year after year.
Anyone who looks up a corridor in the Remittance Prices Worldwide database should ignore the global average. That number aggregates routes from Germany to Poland alongside Pakistan to Saudi Arabia, and mixing them produces a number that fits no real send. Instead, check the specific corridor figure, and make sure it is the total cost for sending $200. The fee line by itself is a distraction. The spread is where the real money vanishes, and it will not appear in the promotional banner promising “zero fees.” The database is built so that a user can compare total corridor prices directly, and the UN target of 3 percent is a total-cost target. When the spread remains stubbornly above two percentage points for almost every provider type, hitting that target means someone, somewhere, has to give up the margin they are counting on. For now, the meaningful difference between one corridor and another sits almost entirely in that silent, padded exchange rate.
New material is signed by the newsroom, not by a personal byline: a name would have to come from somewhere, and there is no source for one. Corrections with a source are welcome at [email protected].
Updated
The promise sounds absolute—10 units of local currency for one dollar, every day, no exceptions.

Nigeria's National Bureau of Statistics concluded its rebasing and re-benchmarking exercise in July 2014

The Drewry World Container Index reports the Shanghai–Rotterdam rate at $3,125. That buys one 40ft container, one lane, one sailing, little else.